

Value chain emissions are the indirect greenhouse gas impacts a company generates through its upstream suppliers and downstream customers rather than its own facilities or fleet. Under the Corporate Value Chain (Scope 3) Standard, these fall into 15 categories, and for most sectors they dwarf direct emissions. Cross-company research on product footprints found a large portion of life-cycle emissions sit upstream and a significant share downstream, leaving a smaller share inside a company's own operations. That imbalance is why regulators, investors, and the Science Based Targets initiative now treat Scope 3 as the main event, not a footnote.
The immediate move for any team starting this work is a rapid hotspot screen, not a full inventory build.
- Use spend-based or average-intensity data to size every category quickly
- Flag the two or three categories driving most of the estimated total
- Save supplier-specific data collection for those priority categories only
Key Takeaways
Value chain emissions typically make up the majority of a company's carbon footprint, and a spend-based hotspot screen is the fastest credible way to find out where.
| Point | Details |
|---|---|
| Scope 3 usually dominates | Upstream activity averages 44.5% of life-cycle emissions, and downstream use and disposal roughly 32.3%. |
| Screen before you build | Use spend-based or EEMRIO data to size all 15 categories before committing to detailed supplier data collection. |
| Prioritize by influence, not just size | Rank categories by size, feasibility, and your ability to influence the supplier or customer, not size alone. |
| Document every allocation choice | Undocumented allocation and emission factor sourcing is the most common reason inventories fail assurance review. |
| Granular reporting drives results | Companies publishing stage-level product footprints reported average reductions of 10.9%, versus 3.7% without that detail. |
Table of Contents
- Understanding Value Chain Emissions and Setting Inventory Boundaries
- Why Value Chain Emissions Dominate Corporate Footprints
- Measurement Methods and the Scope 3 Data Hierarchy
- Hotspot Screening: Where to Focus Limited Resources
- Reduction Levers: Engaging Suppliers and Customers
- Reporting, Targets, and Assurance Expectations
- Practitioner Checklist: From Screening to Assured Reporting
- Closing the Capability Gap With Structured Training
- Ready to Build Real Scope 3 Capability?
- What the Screen-First Approach Gets Right, and Where Companies Still Get It Wrong
- Sources
Understanding Value Chain Emissions and Setting Inventory Boundaries
Value chain emissions cover 15 categories split between upstream (categories 1 through 8) and downstream (categories 9 through 15) activity. The GHG Protocol's Scope 3 Standard uses a "payor rule" to decide which side a category falls on: if your company pays for a good or service, the associated emissions are upstream; if a customer pays you and then uses or disposes of your product, they're downstream.
- Purchased goods and services — raw materials, components, and packaging bought from suppliers
- Capital goods — machinery, buildings, and equipment your company acquires
- Fuel and energy-related activities — upstream emissions from fuels and electricity not already counted in Scope 1 or 2
- Upstream transportation and distribution — freight and logistics paid for by your company
- Waste generated in operations — disposal and treatment of operational waste
- Business travel
- Employee commuting
- Upstream leased assets
- Downstream transportation and distribution — freight paid for by the customer
- Processing of sold products — further manufacturing by a downstream party
- Use of sold products — the largest category for many manufacturers
- End-of-life treatment of sold products
- Downstream leased assets
- Franchises
- Investments — material for financial institutions and holding companies
The Standard sets minimum boundaries requiring companies to account for all relevant categories, but permits excluding activities that are genuinely immaterial, provided that judgment is documented rather than assumed.
Why Value Chain Emissions Dominate Corporate Footprints
A Nature 2020 study of cross-company product footprints found upstream activity averages 44.5% of life-cycle emissions, direct operations about 23%, and downstream use and disposal roughly 32.3%. Those shares vary enormously by sector: an apparel brand's hotspot sits in raw material and dyeing processes upstream, while an automaker's hotspot sits almost entirely in category 11, the fuel burned over a vehicle's lifetime. A software company's biggest lever might be category 15, the emissions embedded in its investment portfolio.
Materiality in this context isn't academic. Category size correlates directly with financial and reputational exposure:
- Investors increasingly price transition risk into companies with large, undisclosed upstream exposure
- Customers in regulated sectors are pushing decarbonization requirements down their own supply chains
- Insurers and lenders are beginning to factor Scope 3 concentration into risk assessments
The same research found that companies publishing granular, stage-by-stage product carbon footprints reported notably higher average emission reductions compared with companies reporting only aggregate numbers. Detail drives action because you can't cut what you can't see.
Measurement Methods and the Scope 3 Data Hierarchy
The Scope 3 Calculation Guidance lays out four calculation approaches, and picking the right one for each category is the single most consequential decision in a Scope 3 program.
- Supplier-specific method: uses actual data from suppliers, such as a vendor's own product carbon footprint. Most accurate, most resource-intensive.
- Hybrid method: blends supplier data with secondary data to fill gaps, common when only some suppliers can respond.
- Average-data method: applies sector-average emission factors to activity data, like tons of steel purchased multiplied by an industry-average factor.
- Spend-based method: multiplies dollars spent by an emission factor per dollar of spend category. Fastest to deploy, least precise, useful for initial screening.
- EEMRIO (environmentally extended multi-regional input-output) models: economy-wide models useful when neither supplier data nor granular activity data exists.
The practical migration path runs from spend-based or EEMRIO screening toward hybrid and eventually supplier-specific data for the categories that matter most. Rabobank's analysis of input-output-based accounting treats these models as an acceptable starting point but warns that long-term reliance on them risks double-counting when supply chains overlap across sectors or when a company's own reported Scope 1 and 2 emissions get reflected back into a supplier's I-O-derived Scope 3 figure.
Allocation is the quiet source of most inventory errors. If a supplier reports emissions for a shared production line, you need a documented method, revenue share, mass share, or another defensible basis, for splitting that footprint across customers. Undocumented allocation choices are the first thing an assurance provider will flag.
Pro Tip: Keep a running log of every emission factor source and allocation assumption as you build the inventory. When you eventually swap spend-based estimates for supplier-specific data, that log lets you show auditors exactly what changed and why, rather than reconstructing your logic from memory a year later.
Hotspot Screening: Where to Focus Limited Resources
A full supplier-specific inventory across all 15 categories can take a team over a year and consume significant budget.
- Map spend by category. Pull procurement and financial data into the 15 Scope 3 categories using your general ledger's cost centers as a starting proxy.
- Apply sector emission factors. Multiply each spend category by an average intensity factor to produce a rough emissions estimate per category.
- Rank by four criteria: absolute size, your ability to influence the supplier or customer, feasibility of getting better data, and how much external stakeholders (investors, regulators, customers) care about that category.
- Commit detailed accounting only to the top two or three categories that score highest across those criteria.
Sector research consistently shows that a small number of categories, often purchased goods, use of sold products, or investments, account for the overwhelming majority of a company's Scope 3 total, which is why the screening approach the GHG Protocol Standard recommends works: size everything roughly first, then spend precision where it actually changes decisions. A screen typically takes four to eight weeks with one or two dedicated analysts; a full supplier engagement program for a priority category can run six to eighteen months depending on supplier count and data maturity.
Reduction Levers: Engaging Suppliers and Customers
Cutting value chain emissions requires different tools upstream than downstream, and conflating the two is a common strategic mistake.
Upstream, the levers run through procurement:
- Build emission thresholds or carbon intensity limits into supplier qualification criteria
- Offer capacity-building support (training, tools, financing access) to smaller suppliers who lack carbon accounting capability
- Shift toward longer-term sourcing contracts that give suppliers the certainty to invest in cleaner production
- Weight supplier scorecards toward measured performance, not stated intentions
Downstream, the work centers on the product itself:
- Redesign products to cut the energy or fuel required during use, since category 11 dominates footprints for durable goods and vehicles
- Build circularity into the business model through take-back programs, refurbishment, or leasing structures that extend product life
- Communicate energy-efficient usage guidance to customers where behavior materially affects lifetime emissions
Contractually, the most effective mechanism is tying a share of purchase volume or contract renewal to year-over-year emissions intensity improvement, verified against a method both parties agree to upfront. Pro Tip: Pilot supplier emission clauses with your five largest suppliers by spend before rolling them out contractually across hundreds of vendors. You'll surface data-collection gaps and definitional disputes while the stakes are still manageable.
Reporting, Targets, and Assurance Expectations
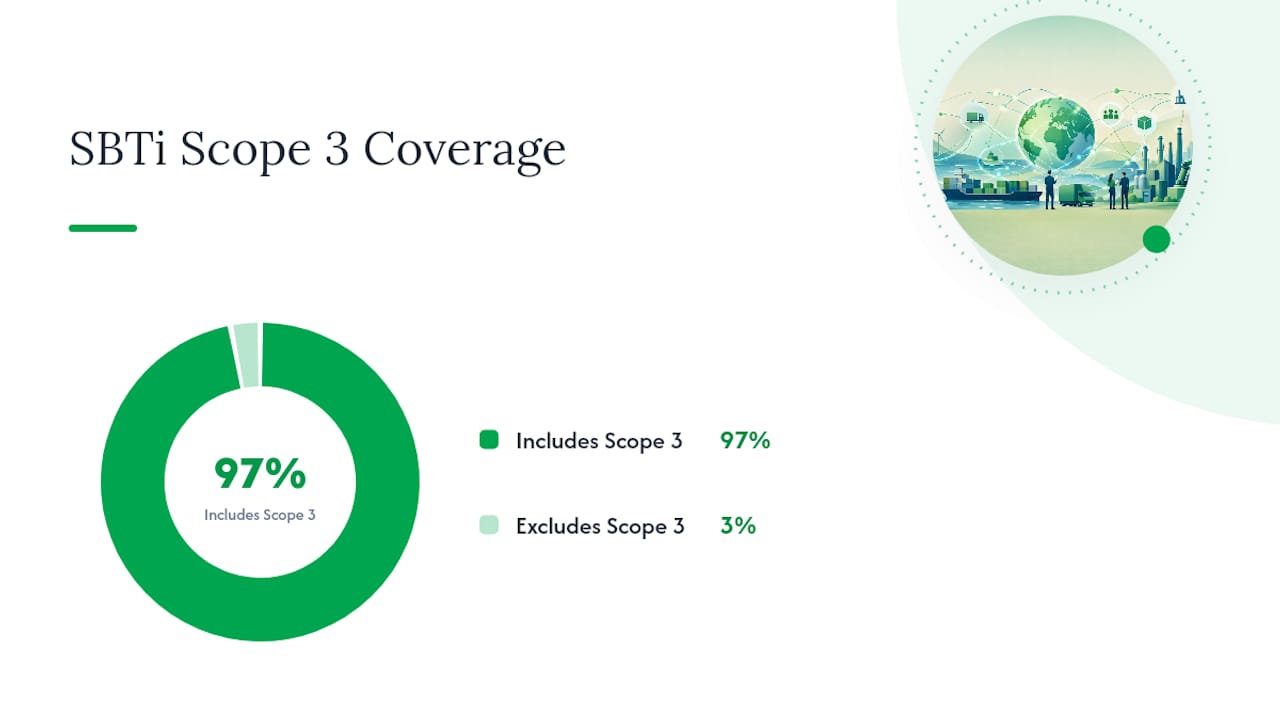
Public disclosure and target-setting now assume Scope 3 is in scope, not optional. By the end of 2023, SBTi-validated targets covered 4,205 companies and financial institutions, and roughly 97% of those targets included Scope 3. SBTi's own research argues aggregate tCO2e targets alone understate progress and recommends pairing them with outcome-based alignment metrics, such as the share of purchased steel that's low-carbon, so companies can show structural change in their value chains rather than just a shrinking number.
Preparing for disclosure and assurance means documenting a few things consistently:
- The calculation method used for each category (supplier-specific, hybrid, average-data, or spend-based) and why
- Emission factor sources and their vintage
- Allocation methodology for any shared or joint-venture activity
- Year-over-year boundary changes and restated baselines
Assurance providers will ask for a clear audit trail connecting activity data to emission factors to reported totals. Building that trail from the first year of measurement, rather than reconstructing it retroactively, is what separates an inventory that survives external assurance from one that doesn't.
Practitioner Checklist: From Screening to Assured Reporting
A Scope 3 program moves through six phases, each with its own deliverable and owner.
- Governance and scoping (weeks 1 to 2): sustainability leads define boundaries and secure executive sponsorship; finance confirms spend data access.
- Rapid hotspot screen (weeks 3 to 8): sustainability and finance jointly map spend to categories and apply average intensity factors.
- Data collection for priority categories (months 2 to 6): procurement leads supplier outreach; external consultants may support supplier data validation at scale.
- Calculation and quality review (months 4 to 7): sustainability team applies the appropriate method per category and documents allocation choices.
- Prioritize and design interventions (months 6 to 9): procurement and product teams co-design reduction levers for the top hotspots.
- Report and assure (ongoing, annual cycle): sustainability and assurance practitioners prepare disclosures and documentation for external review.
An early win worth sequencing first: publish a screened, category-level breakdown even before supplier-specific data exists for every category. It demonstrates transparency, and as the Nature 2020 research on granular product footprints shows, that level of detail tends to precede stronger reduction outcomes, not just follow them.
Closing the Capability Gap With Structured Training
Every phase above depends on people who know how to apply GHG Protocol methods correctly, not just software that can crunch spend data. Teams without that grounding routinely misclassify categories, mishandle allocation, or build inventories that collapse under assurance scrutiny.
Esgtraininginstitute designs its carbon accounting and climate strategy credentials specifically around this gap: applying the Scope 3 Calculation Guidance correctly, building supplier engagement programs, and preparing documentation that holds up to external assurance. Programs are aligned to current regulatory expectations rather than generic sustainability theory, which is part of why graduates now manage more than $30 trillion in ESG assets across jurisdictions.
- Structured coursework on the 15 Scope 3 categories and data-quality hierarchy
- Practical modules on supplier data collection and allocation documentation
- Assurance-readiness training for practitioners preparing external verification
Ready to Build Real Scope 3 Capability?
A hotspot screen tells you where your emissions live. Turning that screen into a defensible inventory, a credible reduction plan, and disclosures that survive assurance review takes trained practitioners who understand the Scope 3 Standard at a working level, not a summary level.
Esgtraininginstitute's accreditation programs are built for sustainability leads, risk officers, and assurance practitioners who need to move from screening to execution without guessing at methodology. If your team is staring at a spend-based estimate wondering what comes next, that's exactly the gap these credentials are designed to close.
What the Screen-First Approach Gets Right, and Where Companies Still Get It Wrong
The evidence in this article points to a conclusion the sustainability field is slow to accept: waiting for perfect supplier data before acting on Scope 3 is the single most expensive mistake a team can make. The Rabobank research on input-output-based accounting makes the case plainly: spend-based estimates are imperfect, but they're accurate enough to point you at the right two or three categories, and every quarter spent chasing supplier-specific precision before that is a quarter of missed reduction opportunity.
Where conventional advice falls short is treating all 15 categories as equally deserving of rigor. They aren't. A category-11 hotspot for an automaker and a category-15 hotspot for an asset manager demand entirely different skill sets, timelines, and stakeholders, yet most generic guidance still recommends a uniform data-collection sprint across the board.
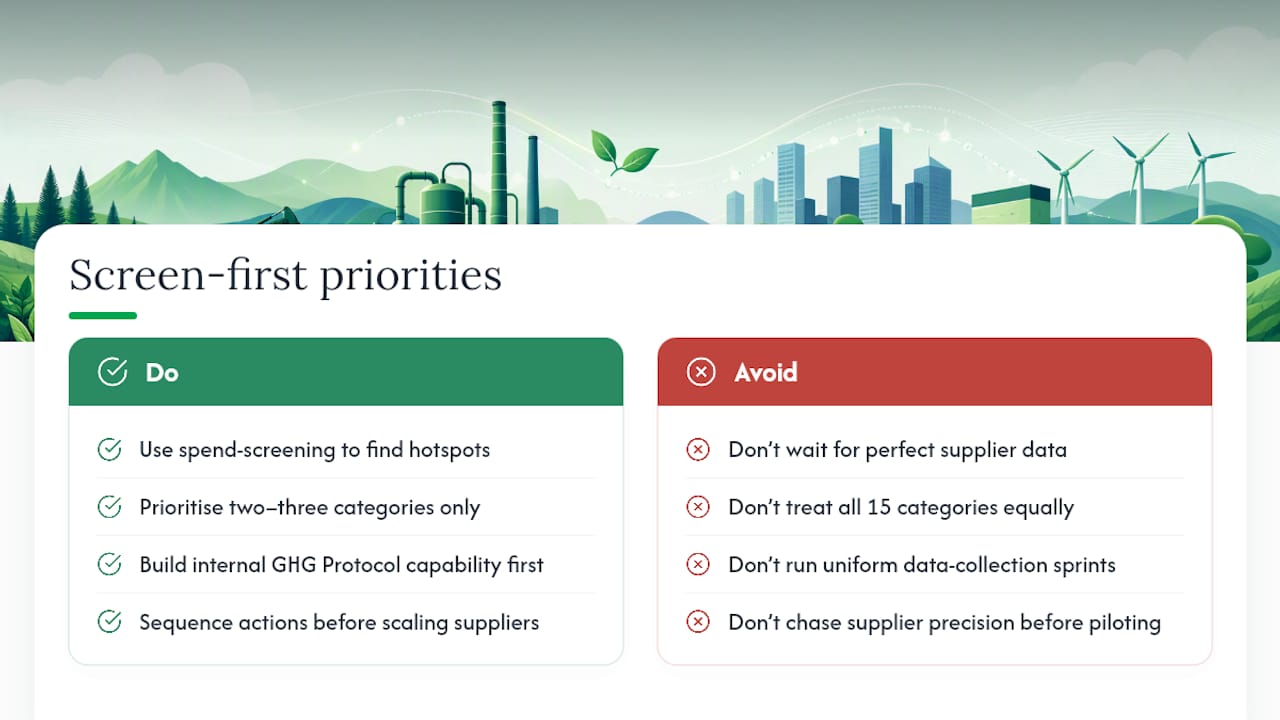
Prioritize the screen, commit real resources to two or three categories, and build the internal capability to apply GHG Protocol methods correctly before scaling supplier engagement. That sequencing, not the sophistication of any single calculation, is what separates inventories that drive reductions from ones that just sit in a disclosure.
Sources
- Corporate Value Chain (Scope 3) Standard - GHG Protocol
- Aligning corporate value chains to global climate goals — SBTi Research (discussion paper)
- Double-checking double counting: quantifying the overlap in input-output table-based Scope 3 emissions - Rabobank