

ESG disclosure benchmarking is the practice of comparing a company's sustainability metrics and reporting quality against peers and recognized frameworks to find where disclosures fall short. The outcome is concrete: a ranked list of gaps against standards like the ISSB Standards and GRI, which tells reporting teams exactly where to focus next year's reporting effort.
TL;DR:
- Keep peer groups narrow, usually fewer than 15 companies, and match them by sector, geography, and scale to avoid noisy comparisons.
- Treat Scope 3 comparisons cautiously because companies set different value chain boundaries, so raw figures may reflect incompatible methods rather than actual performance.
- Normalize emissions and other metrics for company size using revenue, output, or employee counts, and record each source, filing date, and calculation method.
- AI tools can speed extraction across reporting frameworks, but teams must curate source data, verify every result, and retain a provenance log before board use.
- Run quarterly checks on a few fast moving metrics, then complete a full annual benchmark and prioritize gaps by investor relevance, filing deadlines, and cost.
Table of Contents
- What ESG disclosure benchmarking actually covers
- Why benchmarking matters for teams, investors and regulators
- Core metrics and frameworks that belong in your benchmark
- How to run a defensible benchmarking exercise
- Choosing your tools: spreadsheets, platforms or AI assistance
- Turning benchmark results into disclosure improvements
- Building the capability to benchmark well
- What experienced benchmarking leads get wrong, and how to fix it
- Build your team's benchmarking capability with us
- FAQ
- Sources
What ESG disclosure benchmarking actually covers
Benchmarking spans two distinct layers. Quantitative benchmarking compares hard KPIs, emissions intensity, water withdrawal, board composition, against peer averages or sector medians. Qualitative benchmarking assesses disclosure quality itself: whether a company explains its methodology, discloses assumptions, and follows a recognized framework's structure rather than just publishing numbers.
Scope 1 and Scope 2 emissions map cleanly onto this comparison because measurement boundaries are fairly standardized. Scope 3 is harder: companies draw their value-chain boundaries differently, so comparing one company's Scope 3 figure against another's often means comparing incompatible methodologies rather than true performance, a challenge explored further in our breakdown of Scope 3 emissions categories.
Useful sources for harvesting peer data include:
- Annual sustainability or integrated reports.
- Regulatory filings submitted under frameworks such as CSRD/ESRS.
- CDP climate, water and forests questionnaire responses.
- Investor presentations and earnings call transcripts that reference sustainability targets.
Why benchmarking matters for teams, investors and regulators
Comparable disclosures make a company's sustainability story legible to the people who need to act on it. Investors read benchmarked data faster and trust it more because it is positioned against a known peer set rather than presented in isolation.
Benchmarking also builds regulatory readiness. Aligning disclosure structure to ISSB, ESRS or GRI ahead of a mandatory filing deadline reduces the scramble when requirements tighten. Operationally, benchmarking tells a reporting team where to spend limited time and budget.
- Investor relations teams gain a comparable, defensible narrative for sustainability performance.
- Compliance teams get an early read on gaps before a framework becomes mandatory.
- Sustainability teams can direct scarce resources toward the weakest, highest-relevance metrics, often Scope 3 hotspots.
Core metrics and frameworks that belong in your benchmark
A disciplined benchmark starts with a short list of material KPIs rather than every metric a framework offers. Priority areas typically include emissions (both intensity and absolute tons), energy mix, water use, waste diversion, board diversity, and human rights indicators tied to labor practices and supply chains.
Framework alignment shapes how those KPIs get defined and reported:
- ISSB's IFRS S1 and S2 set the baseline for investor-grade sustainability and climate disclosures.
- GRI remains the most widely used framework for broader stakeholder-facing reporting.
- SASB supplies industry-specific, financially material metrics that pair well with ISSB.
- CDP structures climate, water and forest questionnaire data that many peers already disclose.
- CSRD/ESRS adds a European regulatory layer with double materiality requirements.
These frameworks overlap more than they conflict, and a well-built benchmark maps metrics across all of them rather than picking one in isolation, an approach detailed in our comparison of GRI and SASB reporting. Structured benchmark methodologies such as the WBA Core UNGP Indicators show how human rights and social indicators get scored and weighted, and that scoring logic is worth studying before building a social benchmark of your own.
How to run a defensible benchmarking exercise
A reproducible methodology protects your results from the "why did you pick these peers" question that boards and auditors inevitably ask.
- Set objectives and identify material topics before selecting a single peer.
- Choose peers by sector, geography and scale, favoring a tight group over a sprawling one.
- Collect data from primary disclosures first, logging the exact source and filing date for each datapoint.
- Normalize figures into intensity metrics (per revenue, per unit of output, per employee) so comparisons are apples-to-apples.
- Run the gap analysis, ranking weaknesses by framework priority and investor relevance.
- Convert the ranked gaps into a prioritized action list with owners and deadlines.
Pro Tip: Keep peer sets under 10 to 15 companies; a narrower group produces sharper, more actionable gap analysis than a broad sector sweep.
Peer selection trade-offs matter more than most teams expect. A sample that is too broad dilutes the signal, while one that is too narrow risks cherry-picking favorable comparisons, a tension our partner's piece on market benchmarking methodology covers in more depth for teams building sampling frameworks from scratch.
Choosing your tools: spreadsheets, platforms or AI assistance
The right tool depends on team size and governance maturity. Spreadsheets remain the cheapest entry point and work fine for a handful of peers, but they strain once the peer set or metric count grows. Dedicated benchmarking platforms scale better and usually come with built-in framework mapping. AI-assisted extraction tools, including Nasdaq Lens for Sustainability, can pull and compare disclosures across TCFD, SASB, GRI and SEC formats far faster than manual review, though they still require dataset curation and human validation before any result goes to a board.
- Spreadsheets suit small, stable peer groups with low update frequency.
- Platforms suit teams tracking dozens of peers across multiple frameworks.
- AI-assisted workflows suit teams needing speed but require a provenance log for every extracted datapoint.
Whichever approach you choose, control the dataset yourself: curate your own source list, verify extraction accuracy, and keep humans in the loop before publishing a gap matrix, an intensity chart, or a set of framework-aligned disclosure snippets.
Turning benchmark results into disclosure improvements
A benchmark is only useful once it changes what gets disclosed next cycle. Reading the results correctly starts with distinguishing median performance from top-quartile performance: sitting at the median on emissions intensity is a different problem than sitting at the median on disclosure completeness, and each calls for a different fix.
Peer benchmarking contextualizes raw emissions data against industry comparators, which is what makes a gap analysis persuasive to a skeptical board rather than just interesting to a sustainability team, as peer benchmarking practice for GHG data illustrates.
Prioritize fixes using three filters:
- Investor relevance: metrics that show up repeatedly in investor questionnaires move first.
- Regulatory timing: metrics tied to an approaching CSRD or ISSB filing deadline move first.
- Cost-effectiveness: cheap, high-visibility fixes close the gap between effort and signal.
Present results to governance bodies with the methodology attached, not just the scores, so the board can see exactly how peers were chosen and metrics normalized before approving any disclosure change.
Building the capability to benchmark well
Benchmarking well depends less on software and more on whether the people running it understand the frameworks behind the numbers. Standards-aligned training builds that judgment: knowing how IFRS S1 and S2 differ from GRI's stakeholder lens, or how SASB's materiality maps change the KPI list, directly improves how a benchmark gets designed and interpreted.
For sourcing peer data itself, our ESG Company Search functions as a practical starting point: a searchable database of company climate targets and sustainability reports that helps populate a peer set with verifiable primary disclosures rather than secondhand summaries. Standards-aligned training has been widely adopted across sustainability, risk and assurance functions globally.
What experienced benchmarking leads get wrong, and how to fix it
The most common failure is an oversized peer group assembled for optics rather than comparability. A twenty-company peer set with three different revenue scales and two different reporting jurisdictions produces noise, not insight. The second failure is unclear normalization: comparing absolute emissions figures across companies of different sizes without converting to intensity metrics first.

The fix is almost always simpler than the mistake. Narrow the peer list to companies you can defend one by one. Publish your methodology alongside your results, including how you normalized, sourced, and weighted each metric. Automate the repeatable parts, data pulls, unit conversions, framework mapping, so your team's judgment goes toward interpretation rather than data wrangling.
A quarterly check against two or three fast-moving metrics, paired with a full annual deep benchmark timed to the main reporting cycle, keeps the exercise current without consuming a disproportionate share of a lean team's year.
— Ransford
Build your team's benchmarking capability with us
Running a credible ESG benchmark takes the same standards fluency that credible disclosure writing does, and we built our course catalog around exactly that overlap. Rather than selling a benchmarking tool, we train the people who design and interpret one, with certifications mapped directly to ISSB, ESRS, GRI and ISSA 5000 so your team's peer comparisons hold up under investor and auditor scrutiny.
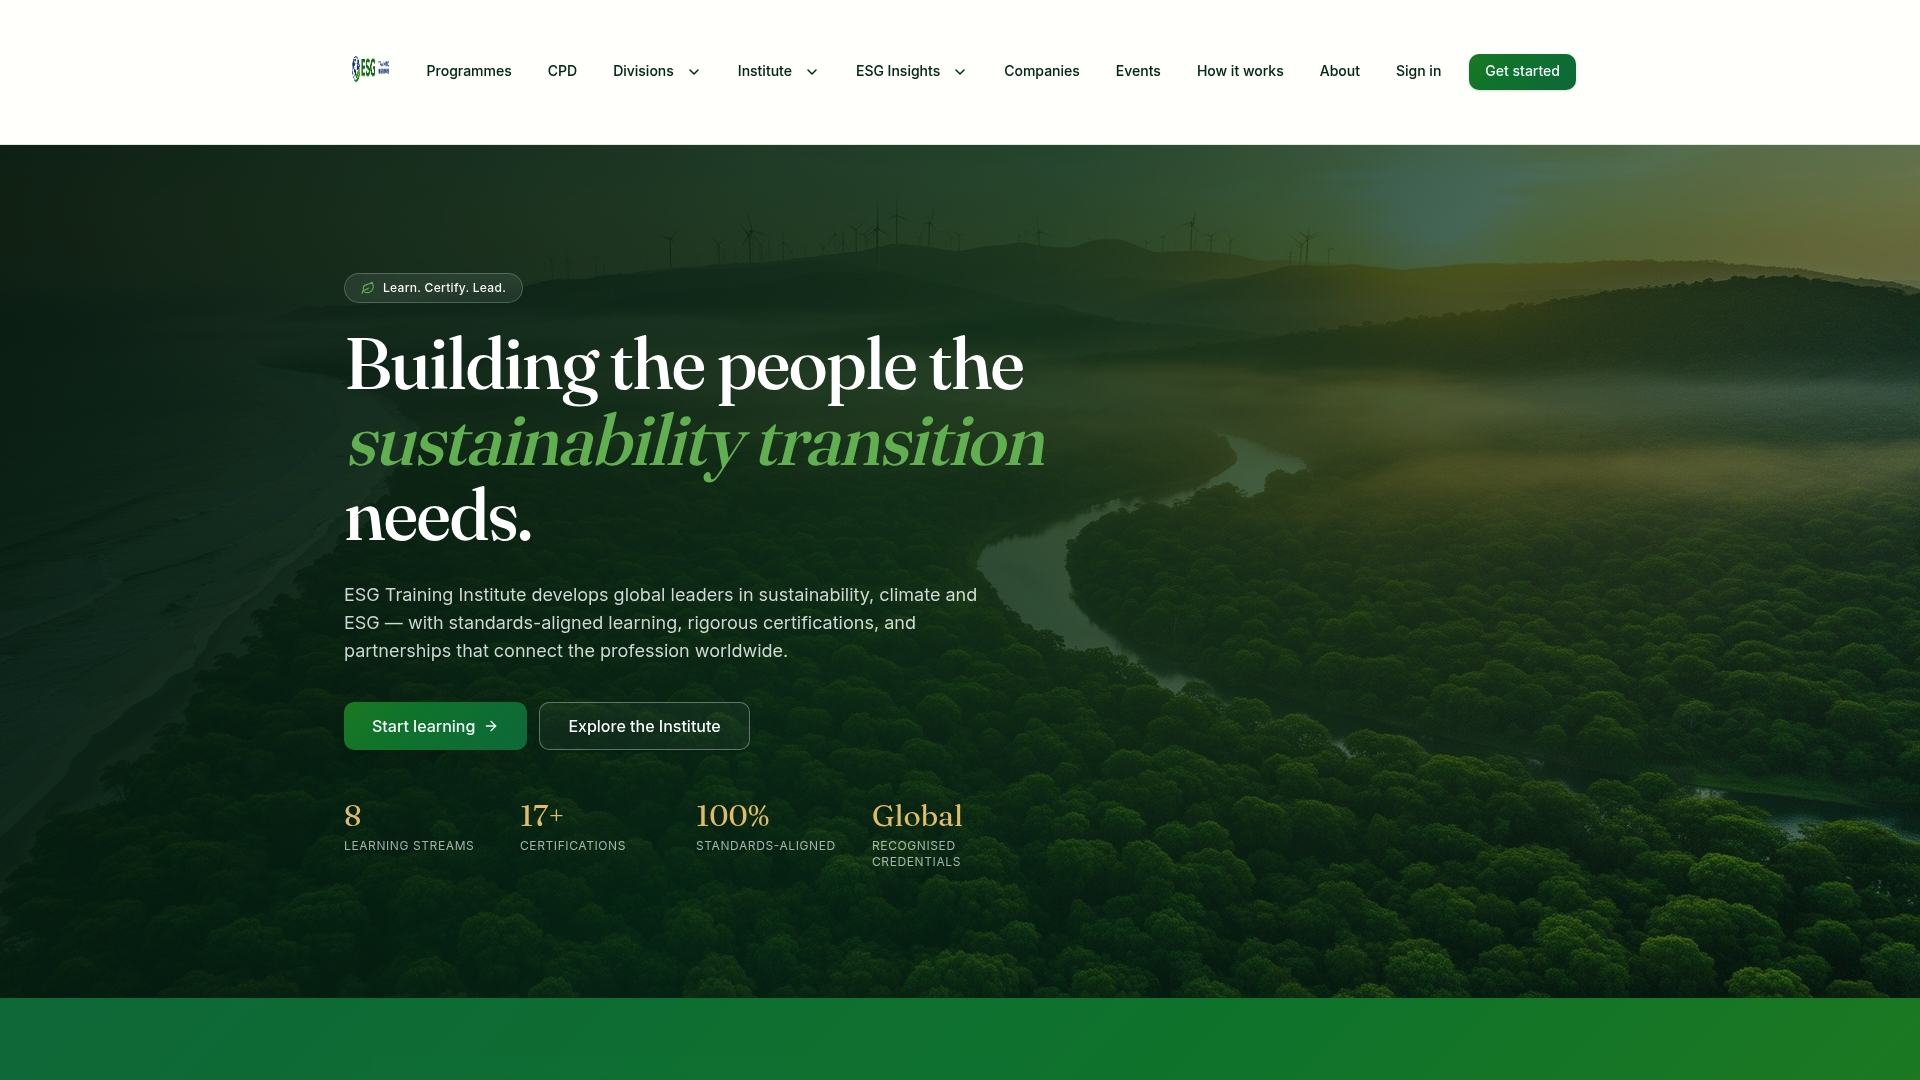
If Scope 3 comparability or framework mapping is the gap in your last benchmark, our Certificate in Carbon Accounting builds the technical grounding for measurement consistency, while the Professional Certificate in Sustainability Reporting covers disclosure structure across major frameworks. Pair either with our ESG Company Search to populate your peer set with verifiable source documents, and browse the full course catalog to find the credential that matches your role.
FAQ
What is ESG disclosure benchmarking?
ESG disclosure benchmarking is the process of comparing a company's sustainability metrics and reporting quality against peers or recognized frameworks like ISSB and GRI. The goal is to identify gaps in disclosure completeness and performance so reporting teams know where to improve next.
Which standards should a benchmark be measured against?
Most practitioners anchor benchmarks to ISSB's IFRS S1 and S2, GRI, SASB, and CDP, with CSRD/ESRS added for companies reporting under European rules. Jurisdictional adoption of ISSB Standards is expanding across many markets, which makes ISSB alignment an increasingly important reference point.
Why is Scope 3 so hard to benchmark against peers?
Companies define their Scope 3 boundaries differently, so a raw comparison often measures methodology differences rather than actual emissions performance. Peer benchmarking practice treats Scope 3 comparability as one of the most persistent challenges in emissions benchmarking.
Can AI tools replace manual ESG benchmarking work?
AI-assisted tools such as Nasdaq Lens for Sustainability can speed up extraction and comparison across frameworks, but they still require curated datasets and human validation before results are used for disclosure decisions. They work best as an accelerator for a process a trained practitioner still oversees.
How often should a company run ESG disclosure benchmarking?
A practical cadence is a quarterly check on a few fast-moving metrics paired with a full annual benchmark timed to the main reporting cycle. This keeps gap analysis current without requiring constant re-collection of every data point.
Sources
- Peer benchmarking for emissions: track & compare GHG data | Maersk
- IFRS Foundation publishes jurisdictional profiles: ISSB Standards
- Core UNGP Indicators (CHRB/WBA)